Back to Don's Maps
Ice Age Maps showing the extent of the ice sheets
The last ice age began approximately 115 000 years ago and lasted until about 12 000 years ago. During this time, the Earth experienced a series of cold and warm cycles, resulting in the growth and retreat of massive ice sheets. The ice sheets covered vast areas of Europe, North America, and Asia, with ice sheets up to three kilometres thick in some locations. The last ice age was characterised by changes in sea level, weather patterns, and vegetation distribution.
It is believed that changes in the Earth's orbit and the amount of solar radiation reaching the planet played a significant role in triggering the last ice age. During this period, the amount of sun's energy reaching the Northern Hemisphere was reduced due to changes in the Earth's tilt and orbit. This, in turn, caused the cooling of the atmosphere, leading to the formation of ice sheets in the Northern Hemisphere. Additionally, volcanic eruptions, ocean currents, and changes in atmospheric carbon dioxide levels also contributed to the onset and duration of the last ice age.
The last ice age had profound impacts on the physical and biological environment of the Earth. For instance, it caused sea levels to fall, exposing land bridges that enabled humans and animals to migrate between different continents. It also led to the extinction of numerous plant and animal species, while others adapted to the harsh glacial conditions. In addition, the ice age influenced the development of human civilisations, such as the creation of early art forms and the domestication of animals for food and transport.
Understanding the causes and consequences of the last ice age can help us better comprehend how the Earth's climate system works, and how it may respond to future changes.
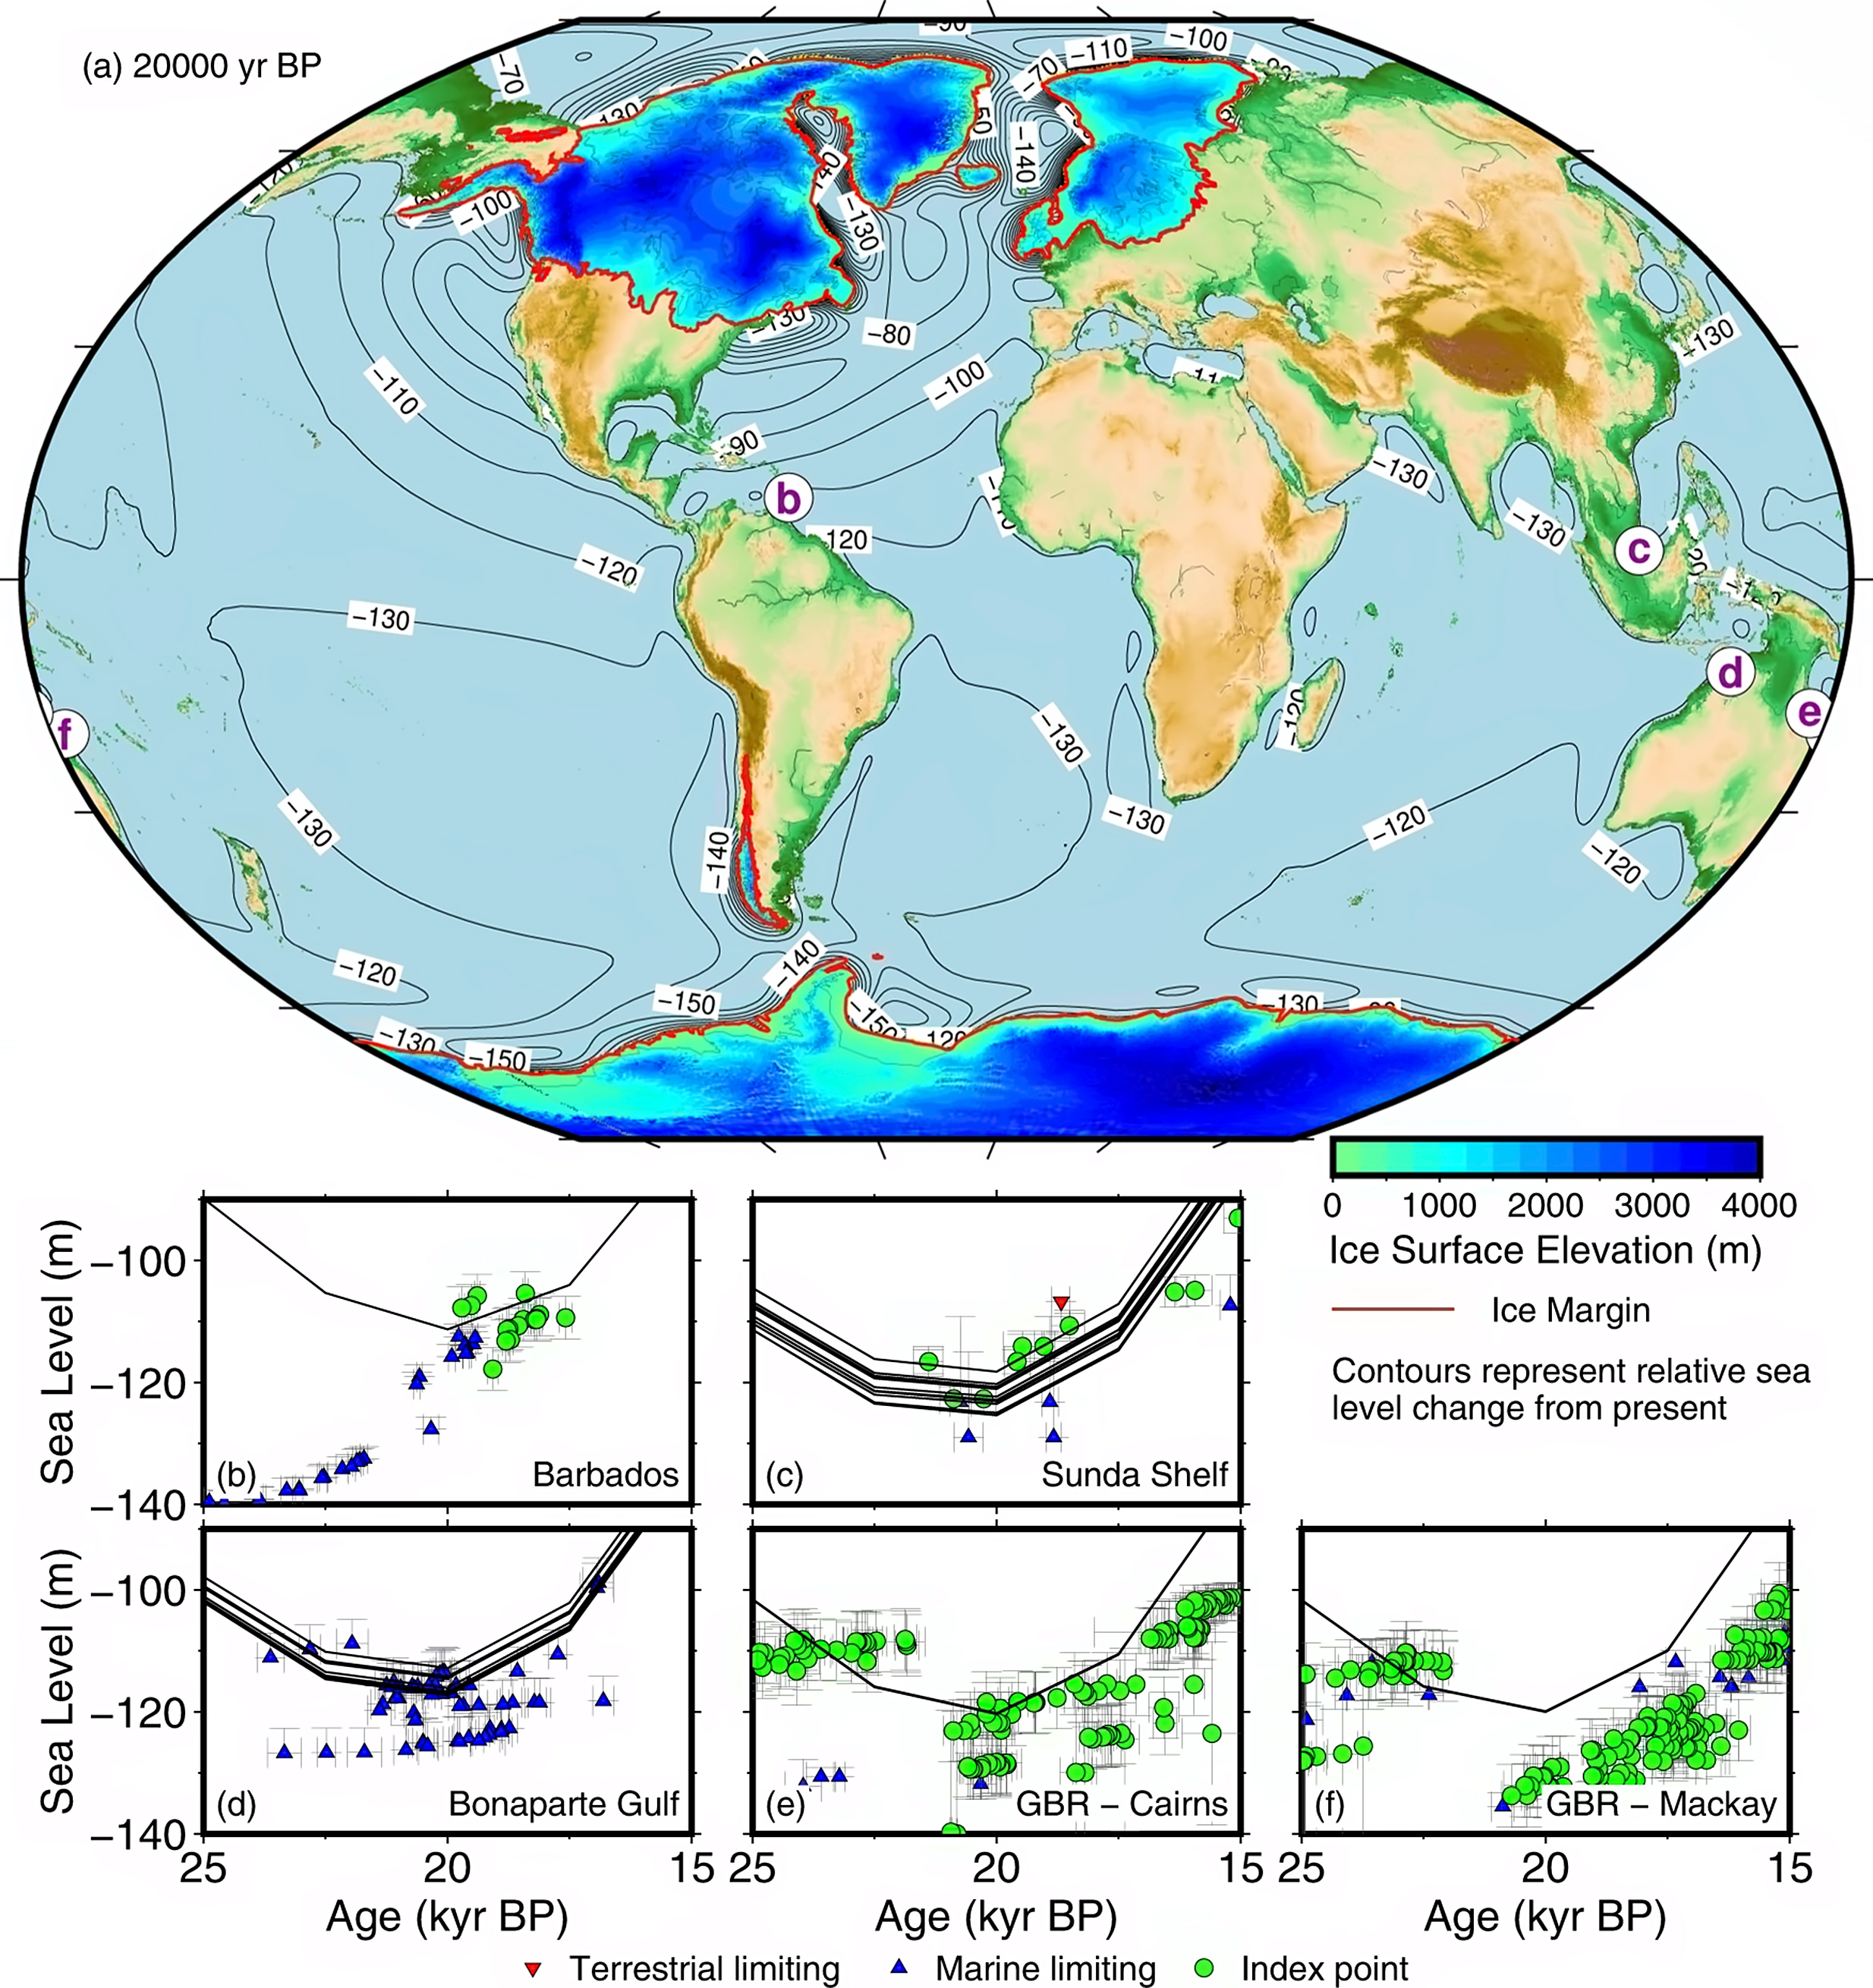
Main map at a, Palaeotopography reconstruction at 20 000 BP, with contours indicating calculated relative sea level compared to the present.
b) Sea level at Barbados 102 metres below present sea levels.
c) Sea level at the Sunda Shelf, 103 - 104 metres below present sea levels.
d) Sea level at the Bonaparte Gulf 105 metres below present sea levels.
e) Sea level at the Great Barrier Reef east of Cairns, 106 metres below present sea levels.
f) Sea level at the Great Barrier Reef east of Mackay, 106 metres below present sea levels.
Multiple calculated sea-level curves on the plots (black lines) are due to the fact that the samples come from a broad geographical region, and there is regional variation in relative sea level. We calculate sea level at the location of each sample. The sea-level indicators include index points (sea level is near or at the elevation of the sample), terrestrial limiting (sea level should be below the elevation of the sample), and marine limiting (sea level should be above the elevation of the sample). Error bars represent 2σ uncertainty in age, and uncertainty in measured elevation and geological context for sea level.
Photo and text: Gowan et al. (2021)
Sea level is not uniform across the globe, and never has been. The reason is that earth's mass is not distributed at all equally, but the mass is what determines gravity at any one point, which determines sea level in a particular spot, and how much it is above or below the mean sea level.
At the Panama Canal for example, sea level is about 20 cm higher on the Pacific side than the Atlantic due to the water being less dense on average on the Pacific side and due to the prevailing weather and ocean conditions.
 The last great ice age began around 120 000 years ago. One massive ice sheet, more than 3 kilometres thick in places, grew in fits and starts until it covered almost all of Canada and stretched down as far as Manhattan. Then, 20 000 years ago, a great thaw began. Over the following 10 000 years, the average global temperature rose by 3.5° C and most of the ice melted. Rising seas swallowed up low-lying areas such as the English Channel and North Sea, forcing our ancestors to abandon many settlements.
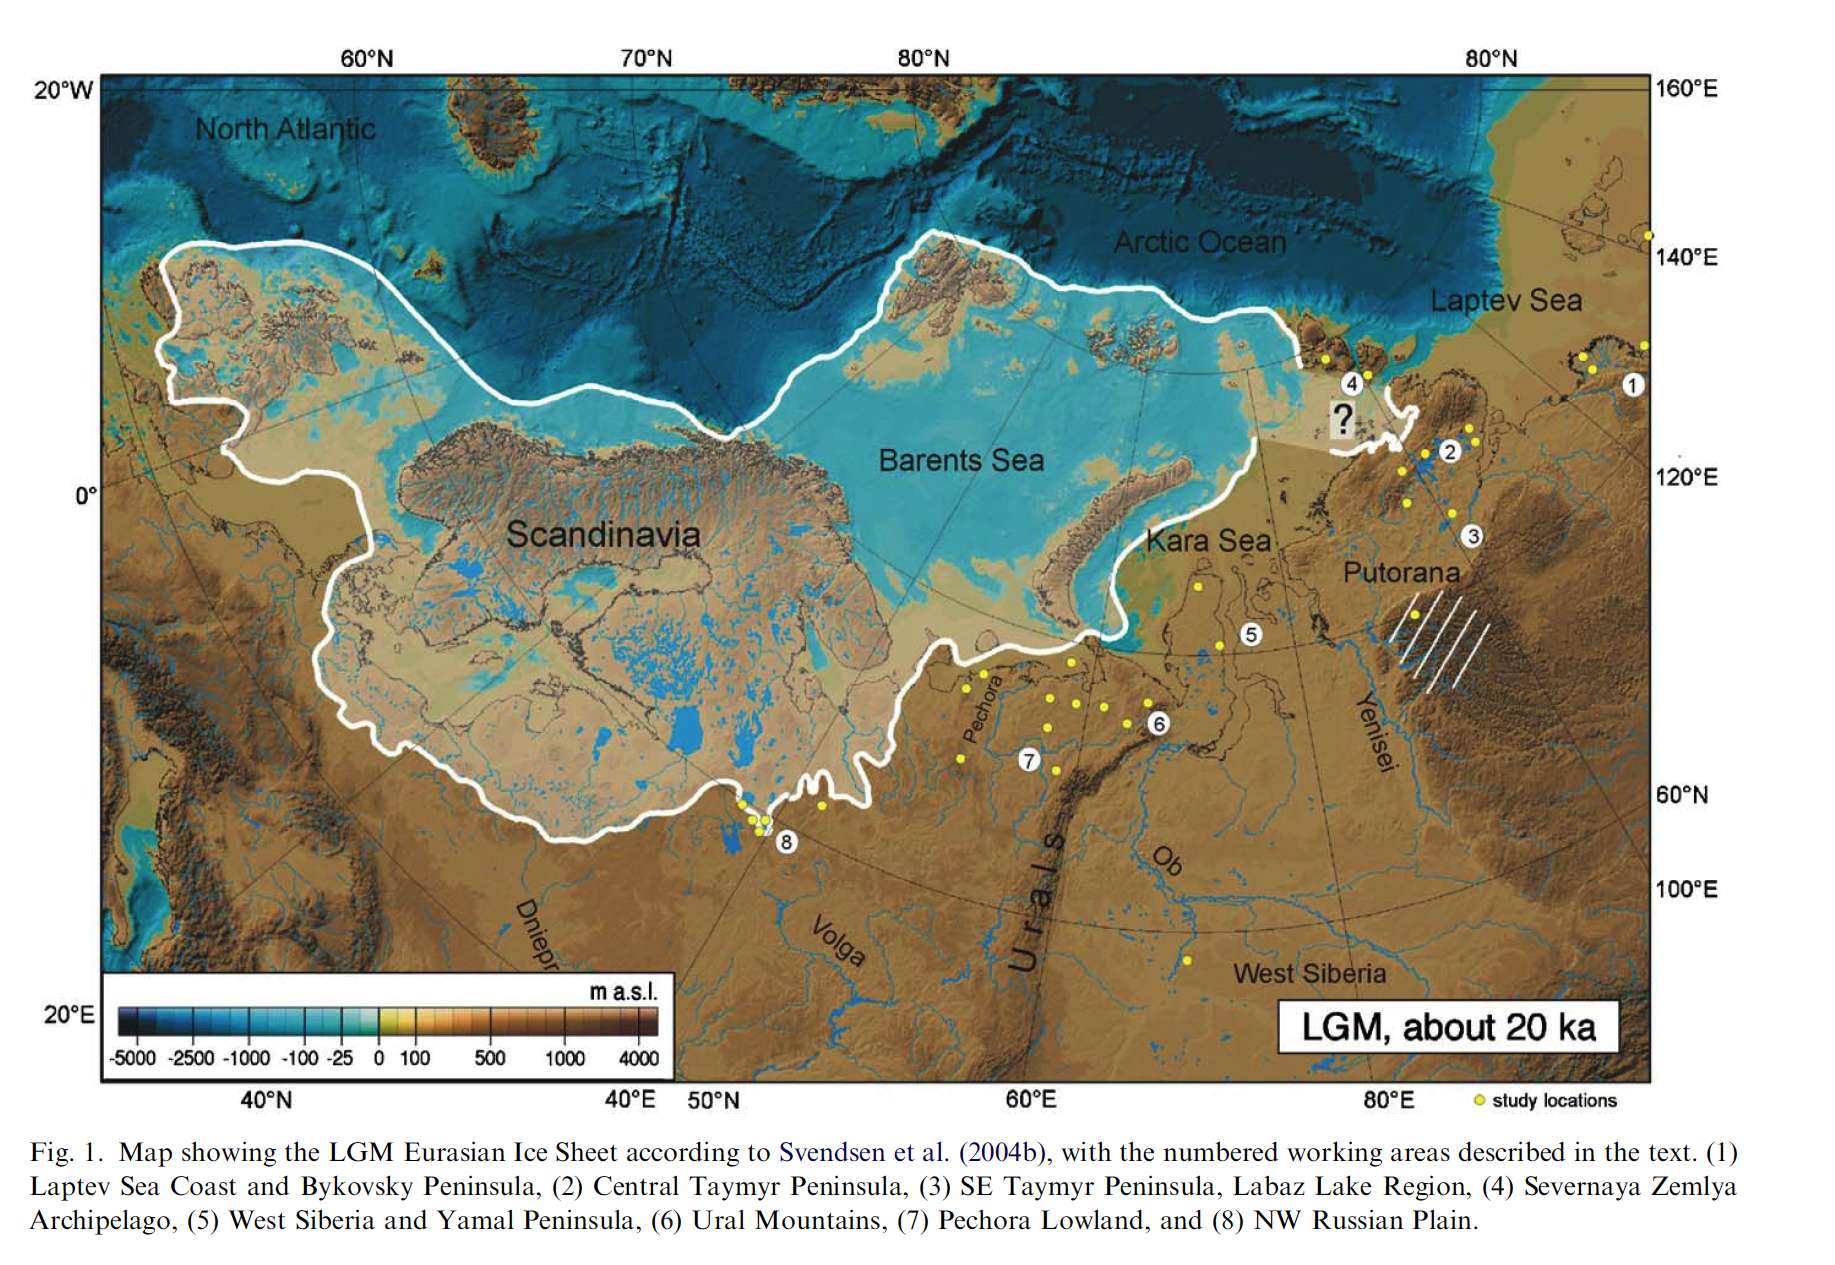
Map showing the Last Glacial Maximum (LGM) Eurasian Ice Sheet according to Svendsen et al. (2004), with the numbered working areas described in the text.
(1) Laptev Sea Coast and Bykovsky Peninsula,
(2) Central Taymyr Peninsula,
(3) SE Taymyr Peninsula, Labaz Lake Region,
(4) Severnaya Zemlya Archipelago,
(5) West Siberia and Yamal Peninsula,
(6) Ural Mountains,
(7) Pechora Lowland, and
(8) NW Russian Plain.
Svendsen et al. (2004)
Ice caps over the British Isles at the end of the last ice age
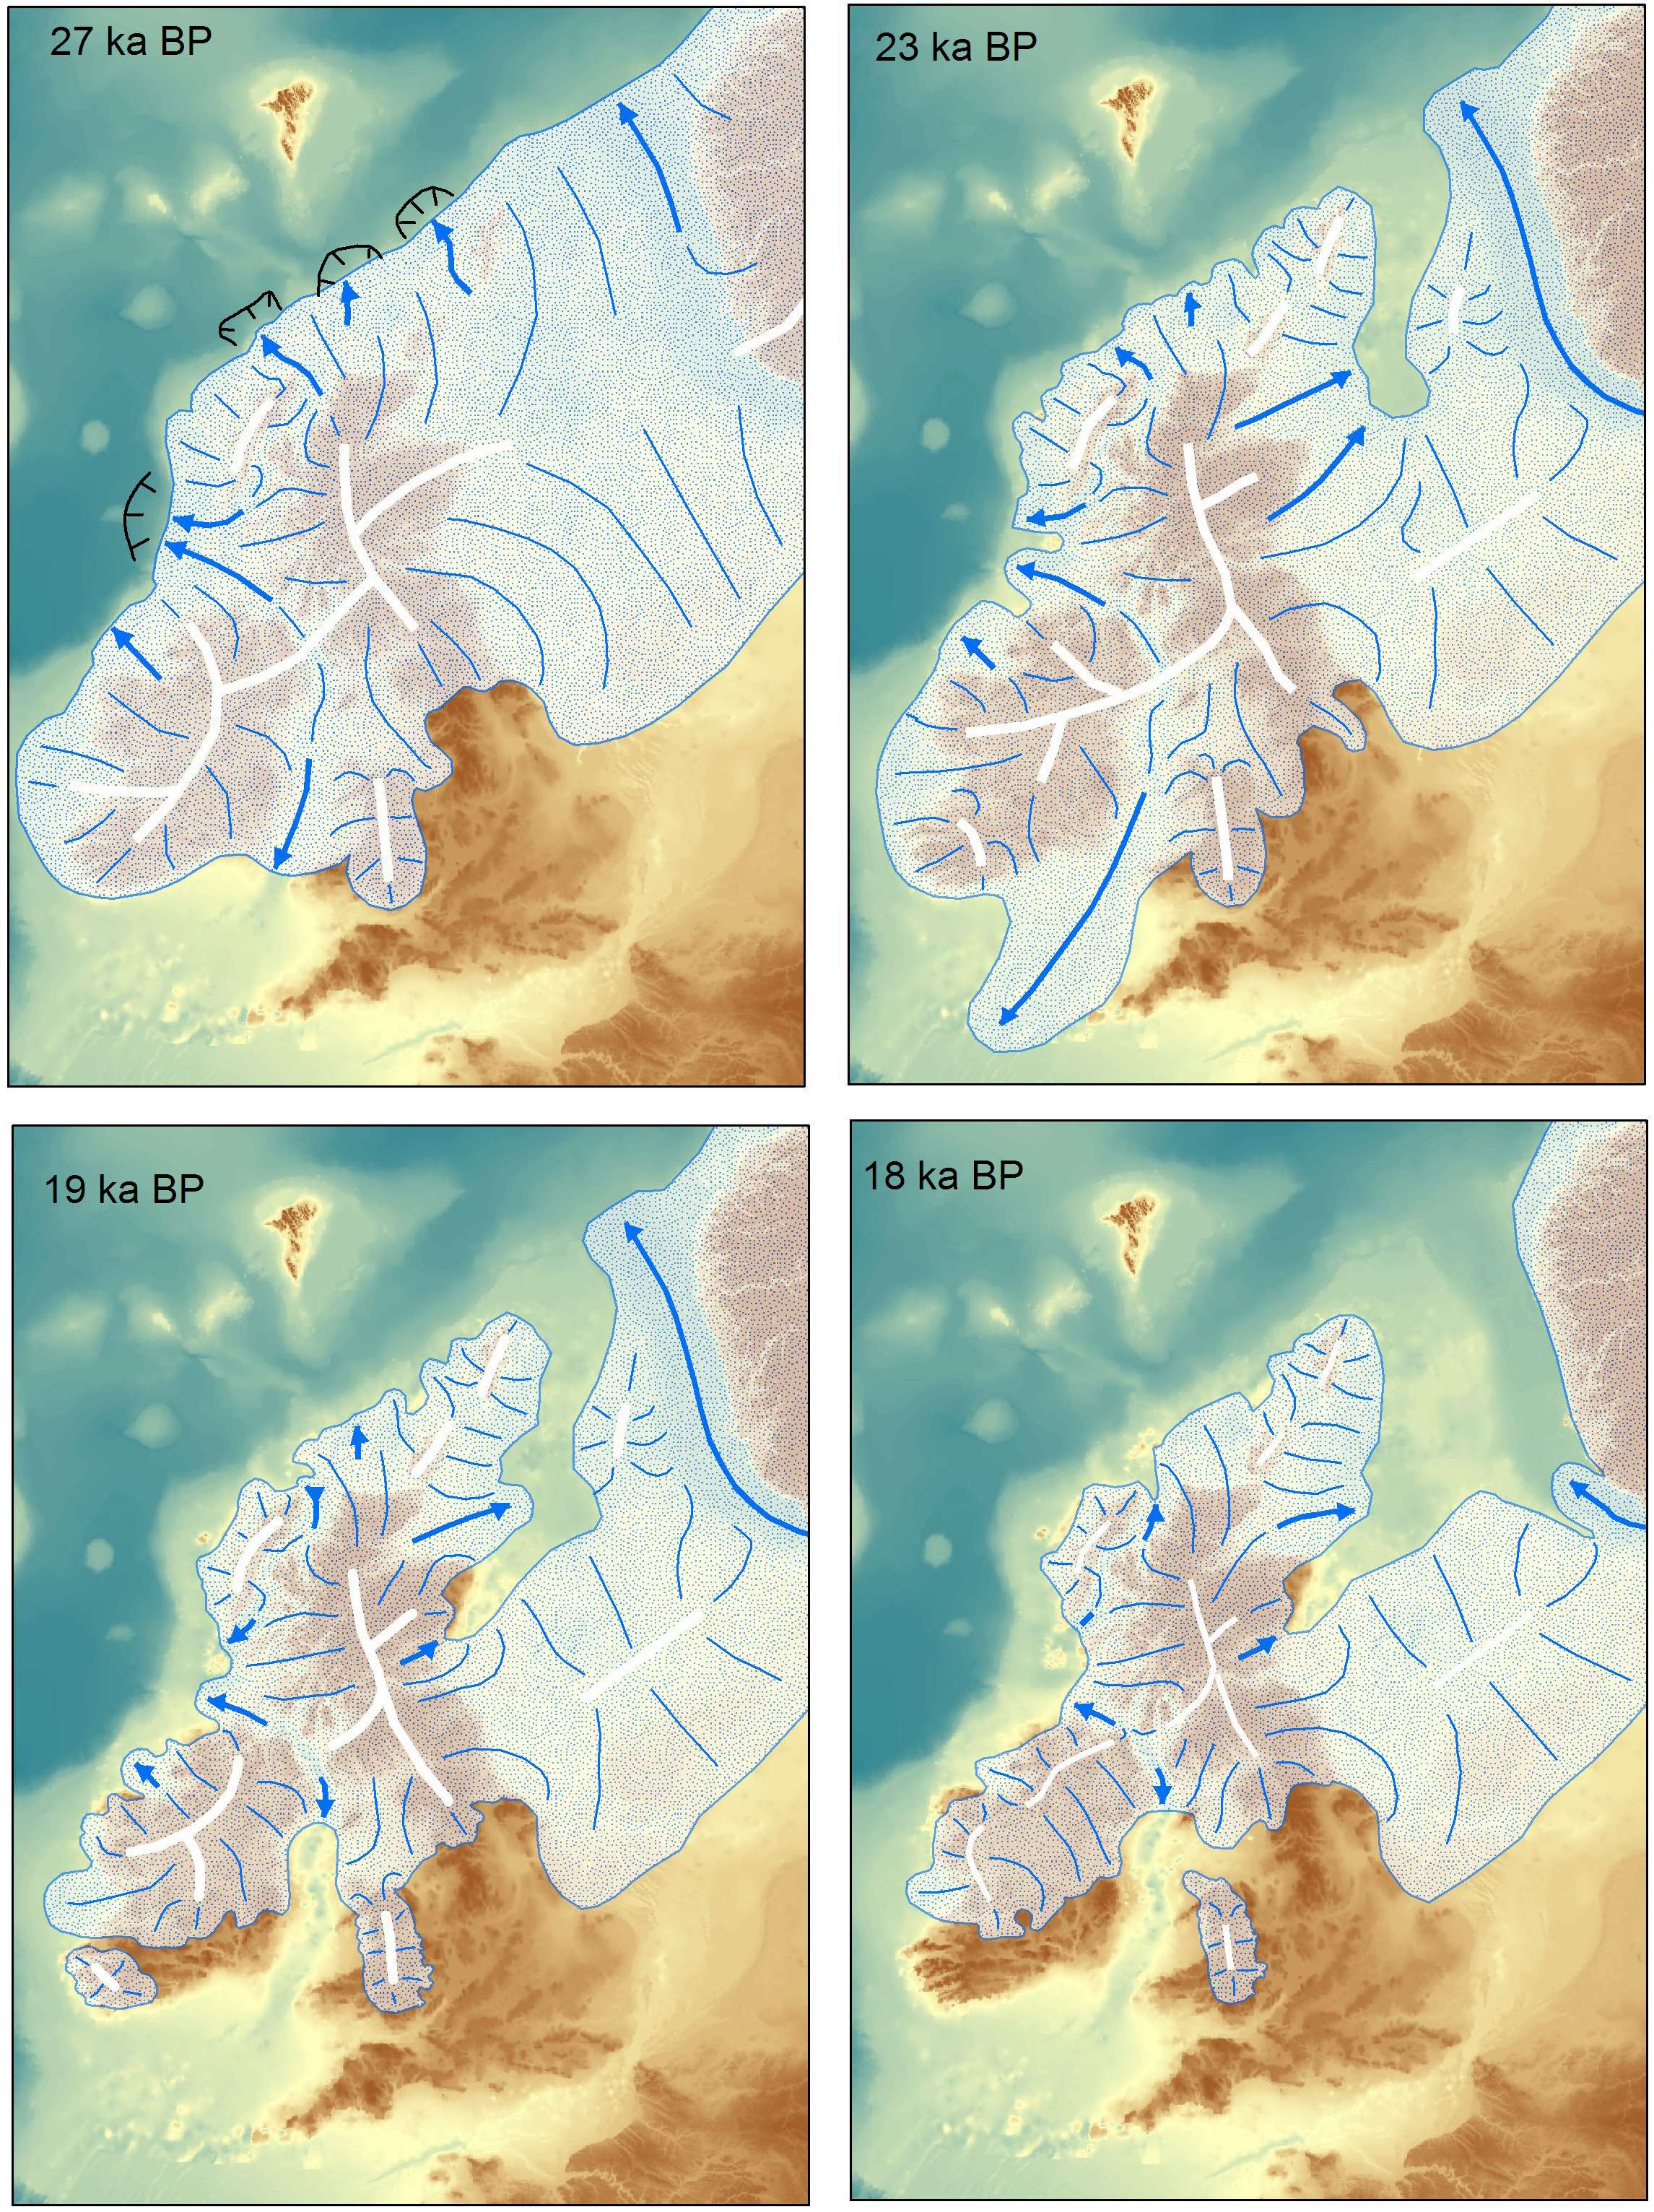
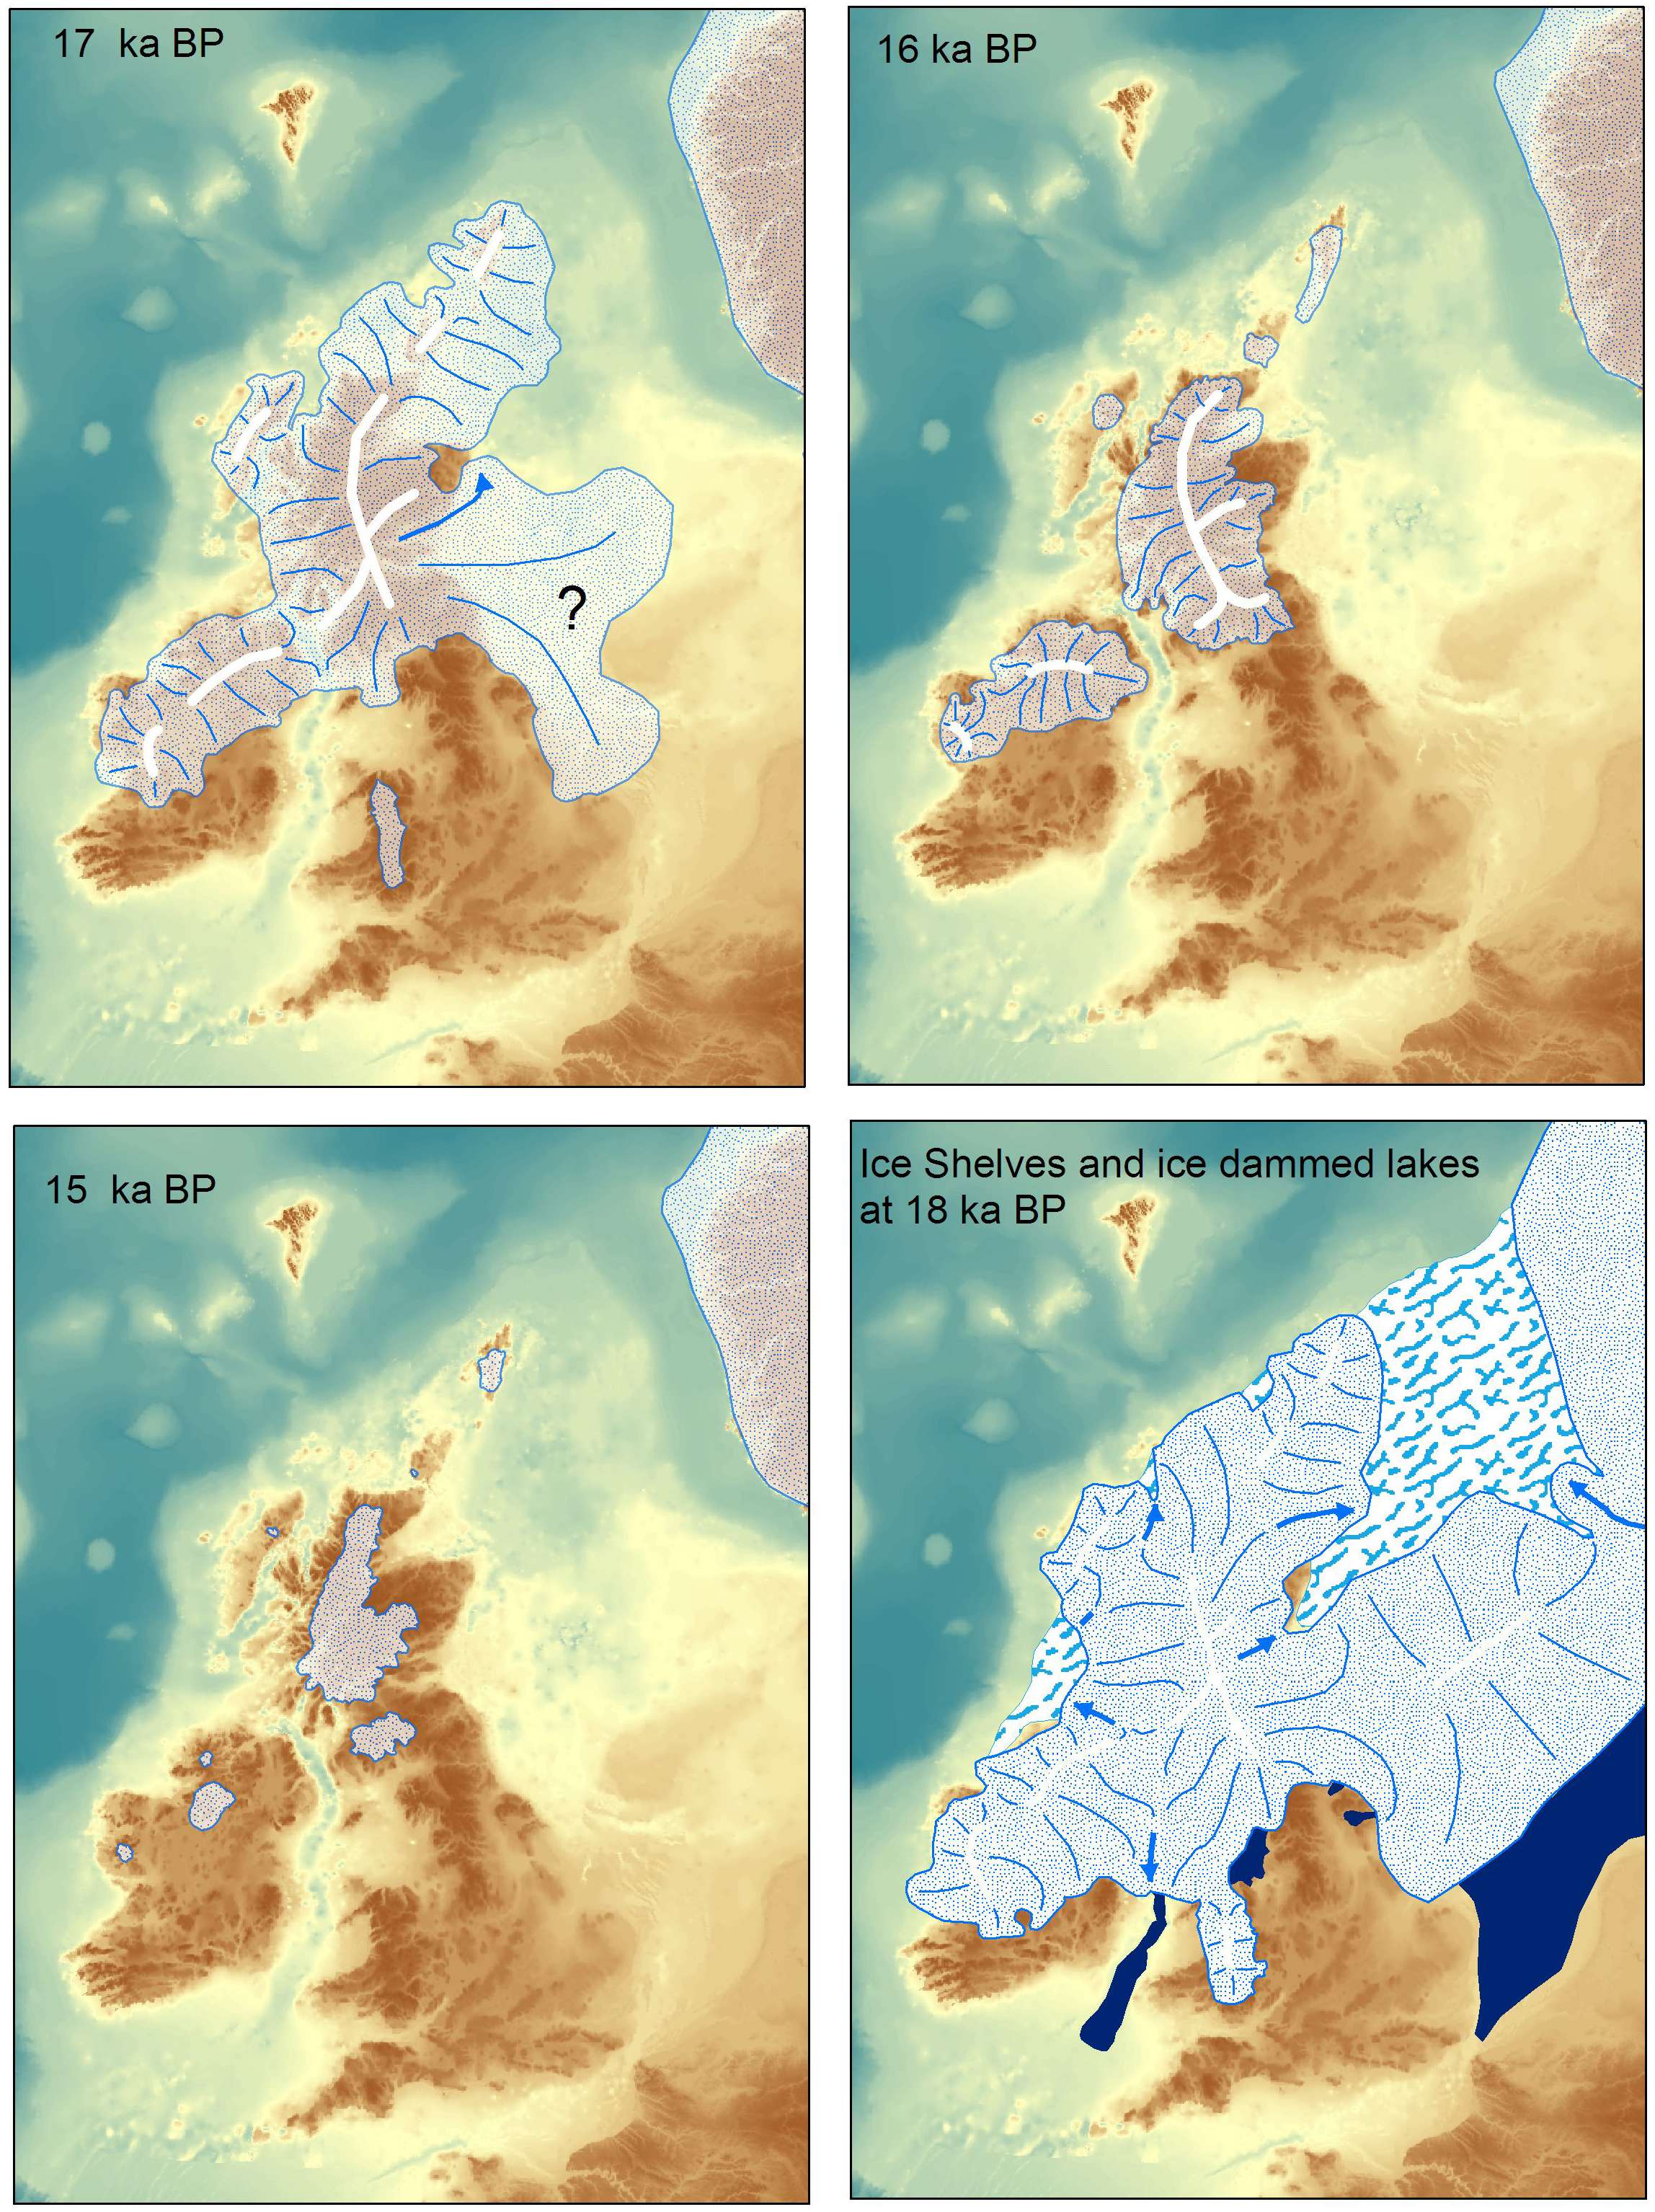
These maps show the rate at which the ice sheet over the British Isles during the last Ice Age melted. The ka on the images is short for thousand years and BP is "before present." So 27 Ka BP is the map of the ice sheet at 27 000 years ago. - University of Sheffield
A set of maps created by the University of Sheffield have illustrated, for the first time, how the last British ice sheet shrunk during the Ice Age. Led by Professor Chris Clark from the University's Department of Geography, a team of experts developed the maps to understand what effect the current shrinking of ice sheets in parts of the Antarctic and Greenland will have on the speed of sea level rise. The unique maps record the pattern and speed of shrinkage of the large ice sheet that covered the British Isles during the last Ice Age, approximately 20 000 years ago. The sheet, which subsumed most of Britain, Ireland and the North Sea, had an ice volume sufficient to raise global sea level by around 2.5 metres when it melted.
Photo: By kind permission of S. Davis, University of Sheffield
Using the maps, researchers will be able to understand the mechanisms and rate of change of ice sheet retreat, allowing them to make predictions for our polar regions, whose ice sheets appear to be melting as a result of temperature increases in the air and oceans.
The maps are based on new information on glacial landforms, such as moraines and drumlins, which were discovered using new technology such as remote sensing data that is able to image the land surface and seafloor at unprecedented resolutions.
Experts combined this new information with that from fieldwork, some of it dating back to the nineteenth century, to produce the final maps of retreat."It is also possible to use the maps to reveal exactly when land became exposed from beneath the ice and was available for colonisation and use by plants, animals and humans. This provides the opportunity for viewers to pinpoint when their town/region emerged.
Professor Chris Clark, from the University of Sheffield's Department of Geography, said: "It took us over 10 years to gather all the information in order to produce these maps, and we are delighted with the results, It is great to be able to visualise the ice sheet and notice that retreat speeds up and slows down, and it is vital of course that we learn exactly why. With such understanding we will be able to better predict ice losses in Greenland and Antarctica. In our next phase of work we hope to really tighten up on the timing and rates of retreat in more detail, by dropping tethered corers from a ship to extract seafloor sediments that can be radiocarbon dated."
Photo:http://www.eurekalert.org/pub_releases/2011-02/uos-rmo021111.php
Text: http://www.archnews.co.uk/featured/5322-researchers-map-out-ice-sheets-shrinking-during-ice-age.html
The maximum extent of the ice over the British Isles in the last ice age

This is a wonderful map, also from Professor Clark's team at the University of Sheffield. Readers can get the original pdf files free from
http://www.sheffield.ac.uk/geography/staff/clark_chris/britice.html
I have combined the information in three maps onto one.
Things to note are that a substantial part of the British Isles was never glaciated, and that there was a huge sea ice dammed lake in parts of the East Anglia - East Midlands area.
The data is from 2002, and it is envisaged that other editions will follow as more information comes to hand.
Photo: http://www.sheffield.ac.uk/geography/staff/clark_chris/britice.html
This is part of the BRITICE project.
Clark, C.D., Evans, D.J.A., Khatwa, A., Bradwell, T., Jordan, C.J., Marsh, S.H., Mitchell, W.A. and. Bateman, M.D. (2004) Map and GIS database of landforms and features related to the last British Ice Sheet. Boreas 33 (4) 359-375 SHERPA Archive version (open access) doi:10.1080/03009480410001983
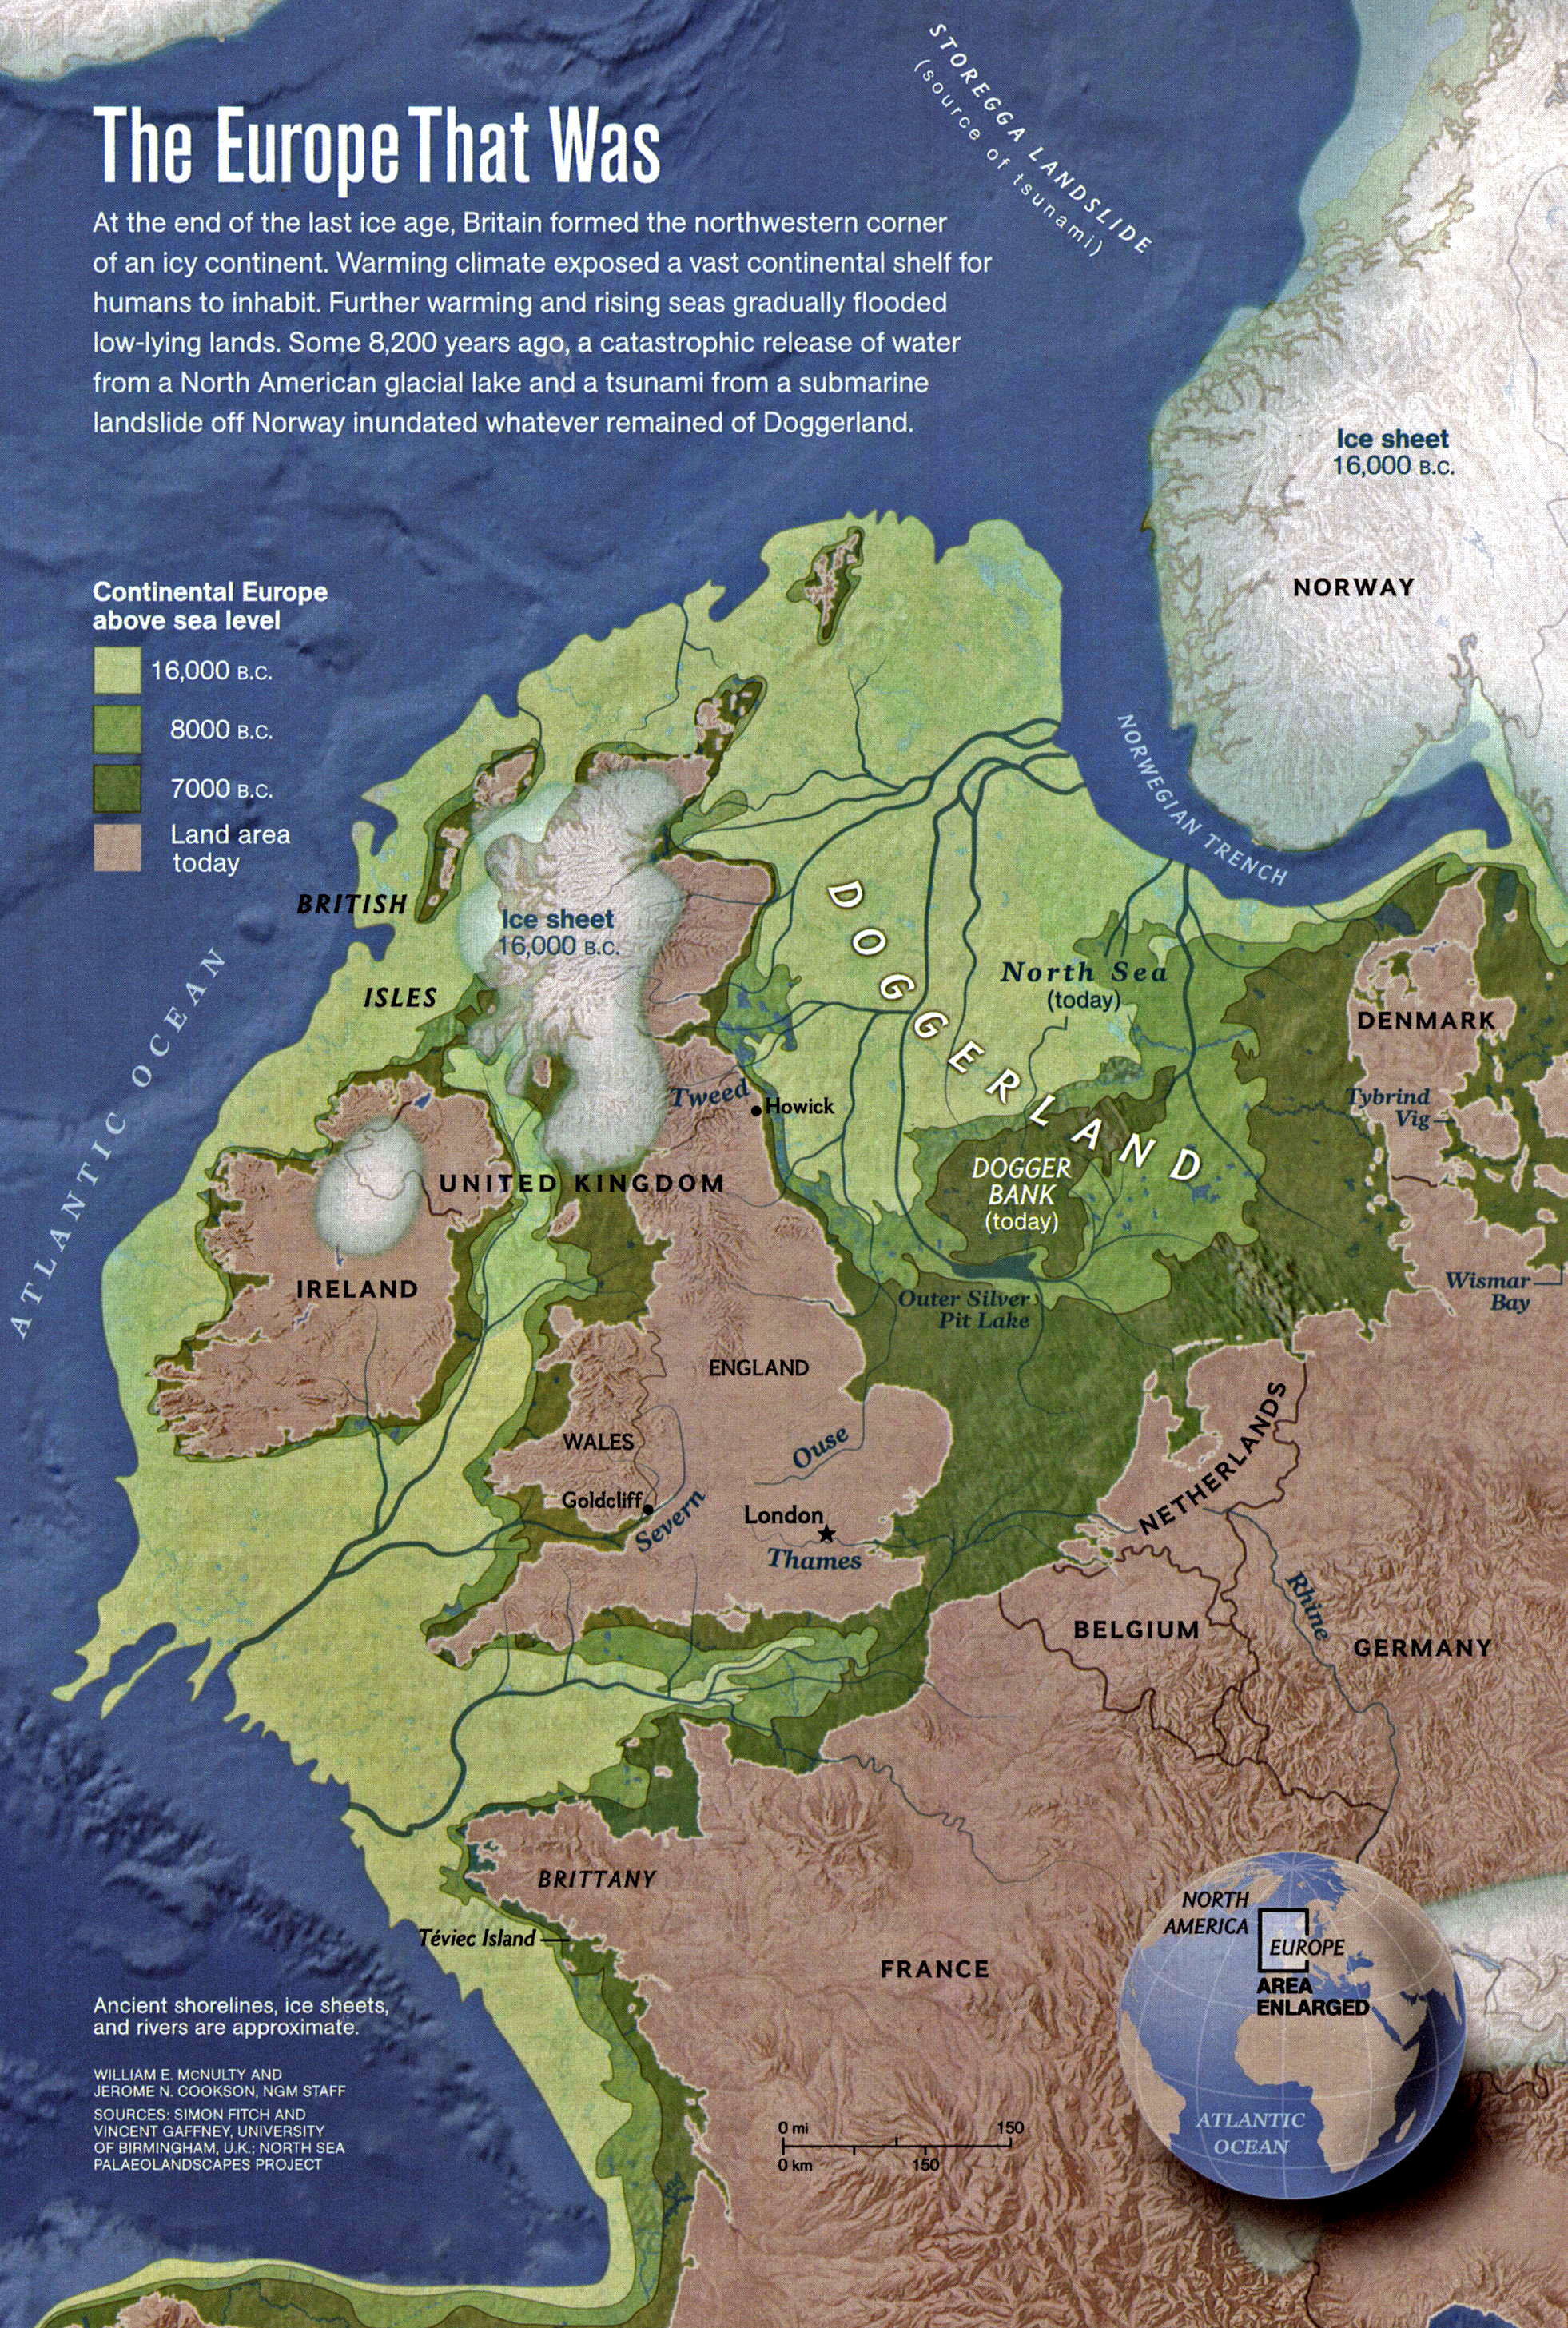
Map of the shoreline in the neighbourhood of the British Isles, ca 18 000 BP.
Note that the ice sheet shown on Britain in this map is much smaller for the same date than most other maps.
Photo: National Geographic Vol. 222 No 6 December 2012
The Ice Ages limits of vegetation and sea level
Click on the photos to see an enlarged version
Ice Age conditions in Europe
A: The position of the polar timberline in present-day Europe
B: The position of the timberline at the most severe stage of the Würm Ice Age.
C: The limits of glacial debris deposited during the Würm Ice Age.
D: The limits of glacial debris deposited during the Riss and Mindel Ice Age.
Photo: Secrets of the Ice Age by Evan Hadingham, 1980
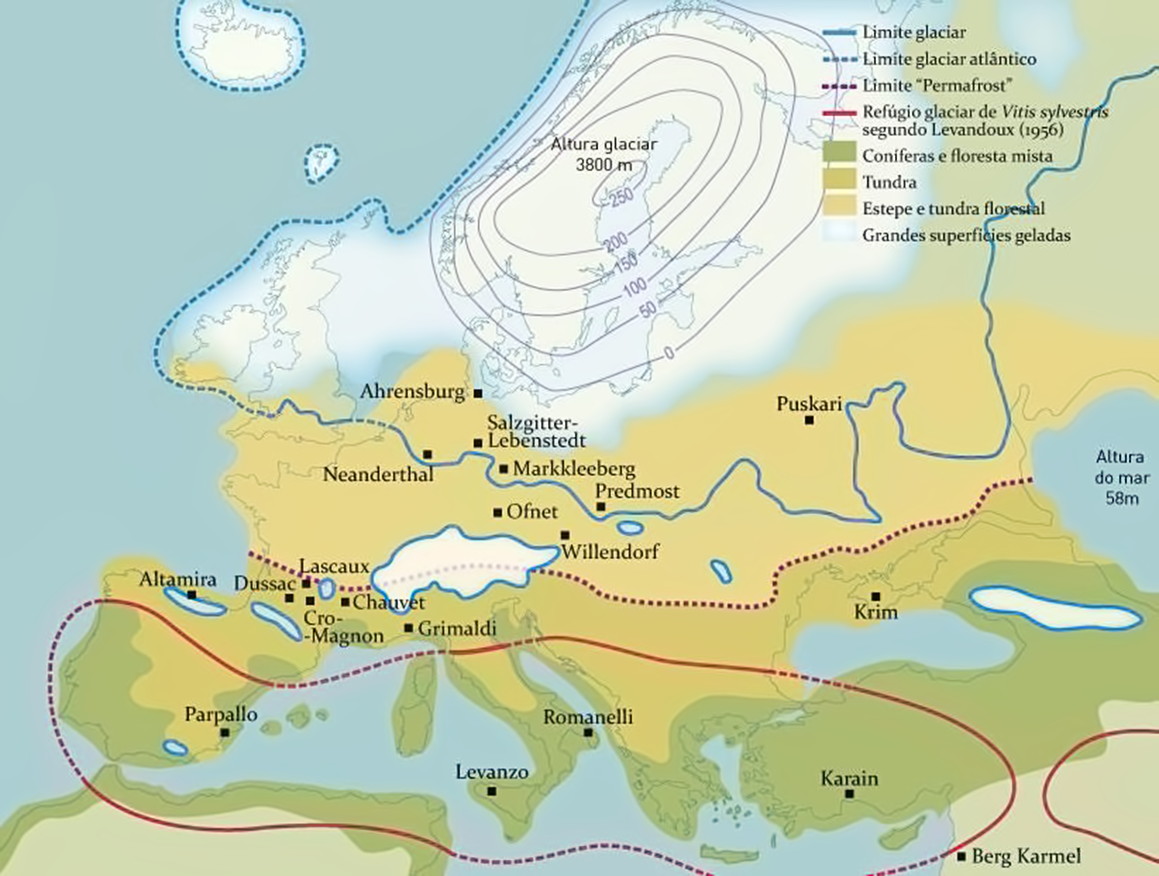
Landscape and the areas and types of vegetarion during the Würm/Weichsel glaciation.
Note that the permafrost level came to just north of Lascaux and Chauvet, and that Predmost (Dolni Vestonice) and Willendorf were within the permafrost zone.
Photo: http://www.vinetowinecircle.com/en/genetics/the-presence-of-wild-vines-during-the-ice-age-in-iberia/
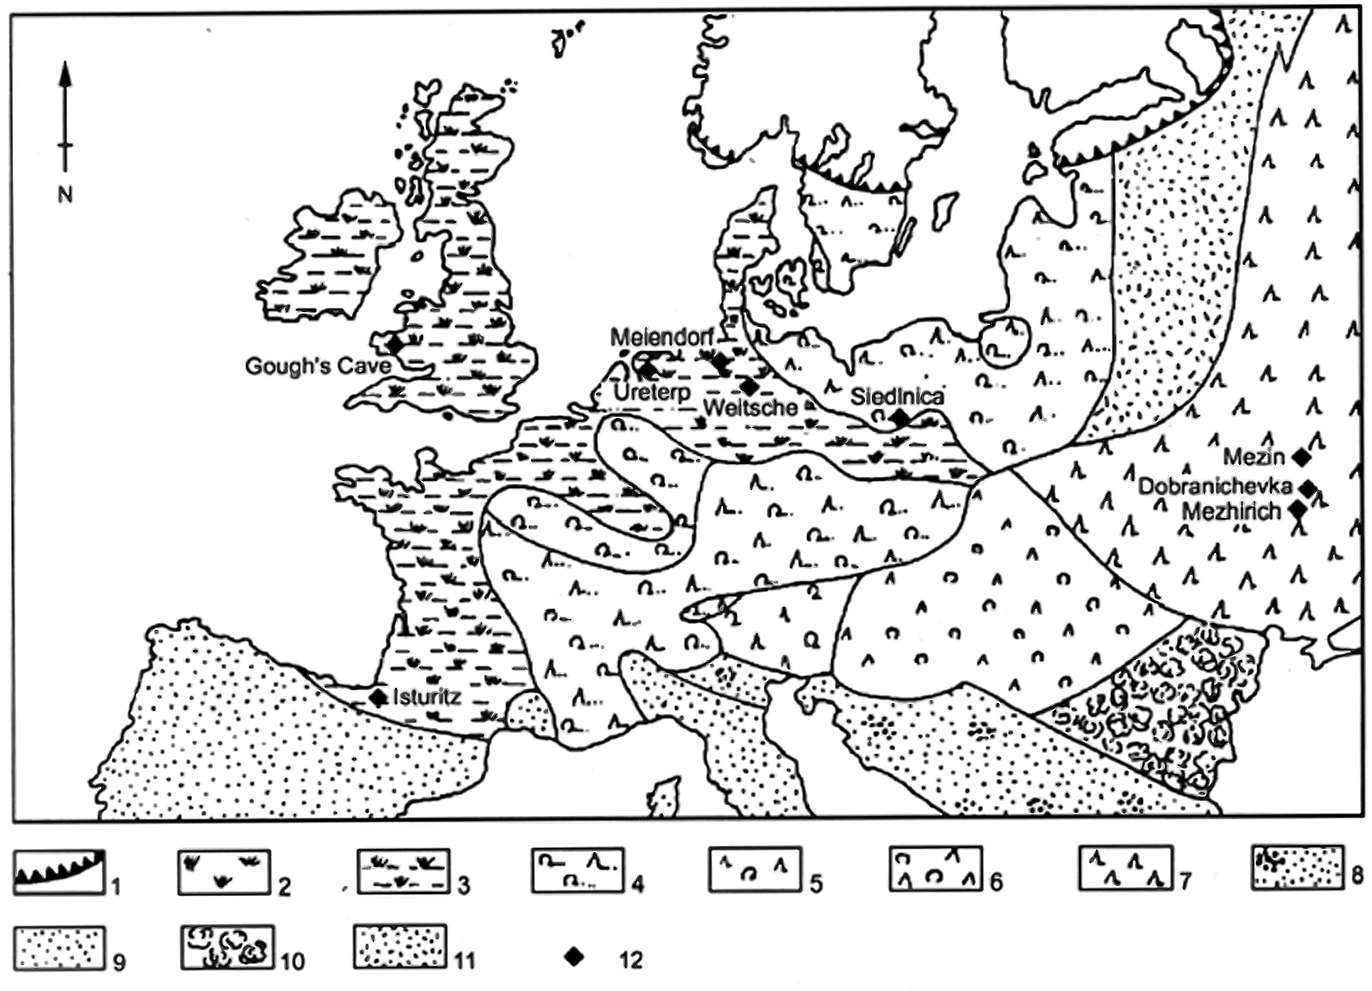
Map of the vegetation in Europe between 13 000 BP and 12 000 BP.
1 - Ice sheet
2 - Tundra
3 - Tundra 'xeric' variant (i.e. dry tundra)
4 - Birch-Pine forest
5 - Mixed forest
6 - Northern mixed conifer-deciduous forest
7 - Spruce dominated forest
8 - Steppe with Gramineae (now called Poaceae)
9 - Steppe (i.e. vast semi-arid grass-covered plain, as found in southeast Europe, Siberia, and central North America)
10 - Mixed-deciduous forest
11 - Mixed forest
12 - Sites with amber artefacts
Photo: Burdukeiwicz (1999)

It is important to realise the changes in climate towards the end of the last ice age.
The history of the development of modern man falls into the most recent geological age, the Quaternary. It began 2.6 million years ago. From a climatic point of view, the quaternary can be divided into cold and warm periods. In contrast to climatically stable warm periods, the climate of the cold periods was characterised by changes from warmer to extremely cold phases. The current warm period, the so-called Holocene, began about 11 570 years ago. The last warm period, the Eem before 126 000 to 115 000 BP, was warmer than at present. This is confirmed by the remains of hippos from deposits near the Thames.
Between the Eem and the Holocene lies the last cold period, which is here referred to as the Vistula. It reached its peak some 24 500 years ago. Between the glaciated areas, which extended from Schleswig-Holstein in the north, to the south to the foothills of the Alps, a life threatening dry and cold frost regime expanded. About 19 000 years ago a climatically milder period began, which ultimately led to resettlement of the area by humans. From 14 650 years BP, the climate changed drastically, the temperatures increased to almost the present level. At first it was still drier in Central Europe, with wide, open grasslands, but soon the rainfall was enough to support a closed forest.
Rephotography of a poster in the LVR-Landesmuseum Bonn: Don Hitchcock 2015
Source and text: LVR-Landesmuseum Bonn, Germany
Sea-level changes during the Pleistocene.
The dotted line shows where the level would be if the modern ice caps were melted.
Note: I cannot work out where the extra water would come from for levels above that at which all the ice caps are melted.
Photo: Secrets of the Ice Age by Evan Hadingham, 1980
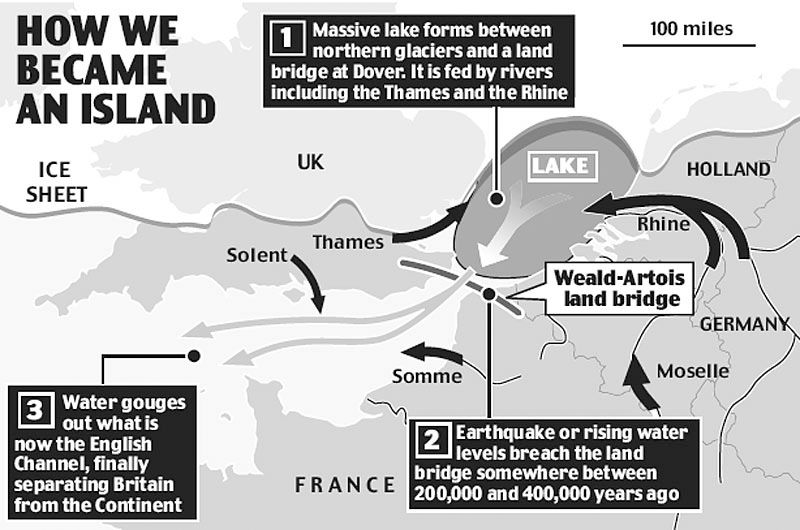
The megaflood that cut Britain from France 200 000 years ago
By David Derbyshire 18th July 2007From: http://www.dailymail.co.uk/
The point when Britain became an island is a defining moment in our history.
Scientists have, however, always been puzzled as to exactly how we lost our land link with the Continent.
Now researchers say they had found the answer in the shape of a massive flood which breached the ridge joining Kent and France.
They said it would have taken only days for what we now know as the English Channel to have filled with water.
The event is thought to have taken place between 200,000 and 400,000 years ago. Britain's fate as an island was sealed by a second massive flood a few thousand years later, the team from Imperial College London said.
The flood waters came from the southern reaches of the North Sea which had been dammed off into a lake by the landbridge at Dover and glaciers to the north.
Once released, the water carved out a channel 15 miles wide and 50 yards deep through the chalky soil.
'We don't know why, but the ridge was breached, triggering what is likely to be the biggest flood ever,' said Dr Jenny Collier, a co-author of the study which examined the loss of the land link.
'It could have been caused by rising water in the lake, or even by a small earthquake.'
Her team took high-resolution sonar images of the valley formed by the first flood showing it was unusually straight and wide with erosion marks. They said this evidence suggested the valley - now under the Channel - was the result of a sudden flood, delivering one million cubic metres of water every second.
The so- called 'megaflood' may have lasted several months and by the time it subsided, a vast, uncrossable waterway separated Britain from the rest of Europe. The river was the largest in Europe, draining the Rhine, the Thames, the Solent, the Rother, the Seine and the Somme. It also created a barrier to Neanderthal hunters who had previously been regular visitors to Britain. Dr Sanjeev Gupta, a co-author of the study, said: 'This prehistoric event rewrites the history of how the UK became an island and may explain why early human occupation of Britain came to an abrupt halt for almost 120 000 years.' The second flood breached a dam that had formed around a ridge of rock north of Dover. This event sent another huge torrent of water into the English Channel and further widened the Straits of Dover.
Taken together, the two floods were probably more dramatic than the breaching of the Straits of Gibraltar that flooded the Mediterranean 5.3million years ago.
"Professor Chris Stringer, an expert in early humans at the Natural History Museum in London, said: 'The timing and method of formation of the Channel has been a long-running argument - after all it really makes Britain what it is today, geographically - and the evidence presented in this paper is spectacular.' Geologists have long known that the rise and fall of sea levels has repeatedly flooded and exposed the floor of the English Channel.
During the ice ages, when much of the northern hemisphere's water was locked up in vast ice sheets, sea levels dropped by 100 yards, allowing Neanderthal men and women to walk from Brittany to Cornwall.
But even when sea levels were at their highest, humans were able to cross the 'Weald-Artois' chalk ridge linking England to France. All that changed when the land bridge was breached. The Imperial College study is published today in the journal Nature.
Maps of the extent of the Ice
My thanks to Thalion for bringing this source to my attention.
All three maps below come from an excellent source which is the printed version of the electronic journal:
Folklore Vol. 18&19
ISSN 1406-0957
Editors Mare Kõiva & Andres Kuperjanov & Väino Poikalainen & Enn Ernits
Published by the Folk Belief and Media Group of ELM
PALAEOLITHIC ART FROM THE DANUBE TO LAKE BAIKAL
Väino Poikalainen
All three maps share the common legend:
![]()
Legend:
1 - continental (a) and maritime (b) glaciers, 2 - open sea, 3 - lakes, 4 - elongated
elevations, 5 - courses of waterways, 6 - primeval valleys (Grosvald 1983: 96-
97) and major sites of prehistoric art before (A) and after (B, C) the glacial
maximum.
Map of the maximum extent of the ice during the last ice age, around 20 000 years ago.
Note in particular the extensive lakes ponded behind the ice, fed by the north flowing rivers.
Note also the increased size of the Caspian and Aral Seas, and the reduced size of the Black Sea.
Map of the extent of the ice during the last ice age 13000 years before the present.
Map of the extent of the ice during the last ice age 10500 years before the present, just before the final retreat of the ice.

Map of the extent of the ice during the last glacial maximum in northern Eurasia, showing the ice sheets, floating ice, and the ice-dammed lakes, as well as the margins of lakes such as Lake Black (the present Black Sea, much reduced in size), Lake Caspian, Lake Aral, and the huge Lake Mansi, as well as many smaller lakes.
Map: Adapted from Grosswald (1998)
Source: http://www.scribd.com/doc/35033650/Fundamentals-of-Geomorphology
References
- Burdukeiwicz, J., 1999: Late Palaeolithic Amber in Northern Europe, Investigations into Amber, Proceedings of the International Interdisciplinary Symposium, 2 - 6 September 1997 Gdansk, The Archaeological Museum Gdansk, Museum of Earth, Polish Academy of Sciences, Gdansk, 1999, pp 99-110.
- Gowan, E. et al., , 2021: A new global ice sheet reconstruction for the past 80 000 years., Nat Commun, 12, 1199 (2021). https://doi.org/10.1038/s41467-021-21469-w
- Grosswald, M., 1998, New approach to the Ice Age paleohydrology of northern Eurasia. In G. Benito,V. R. Baker, and K. J. Gregory (eds) in Palaeohydrology and Environmental Change, pp. 199–214. Chichester: John Wiley & Sons
- Svendsen, J. et al., 2004, Late Quaternary ice sheet history of Eurasia. Quaternary Science Reviews, doi:10.1016/j.quascirev.2003.12.008).